
Its impressive that the income for the Top 1% races off while the income for the middle and lower class is squished towards the bottom.
I was concerned, however, that this chart might be somewhat misleading because even if the various income classes had the same growth rate – not suggesting they did, just saying – the increases for the Top 1% would dwarf everyone else, since they started from a higher baseline.
I tried plotting the income growth as common logs

A similar though, perhaps, less shocking looking story. There is growth, albeit mild in the middle and lower classes, and stronger more robust growth among the Top 1%.
If your used to common logs then you can see that the Top 1% moved from being about an order of magnitude above the middle class to about one and half orders. Or in other words from 10 times greater to 30 times greater.
However, you still don’t get a good sense of the trajectory. For that I plotted an index scale where 100 is income in 1979.

Here we can see that the Top 1% has more than triple its income with fairly steady growth since 1980. The middle and lower classes have seen only about a 15% increase in real income with all of those gains coming after the early 90s.
What’s even more interesting to me is that the gains to the Top 1% seem to be steady and at first glance trend reverting. That is, there appears to be a consistent underlying rate of growth ever since 1980, with income rising above trend during booms and falling below during recessions.
Plotting the trend line reveals that the Top 1% is seeing its income grow at roughly 4.2% per year in real terms.

This is significantly faster than real growth of US GDP.

My first question then is whether this is increasing take of GDP is because of the Top 1% position as high end wage earner or owners of capital. The standard story has largely been that increases in technology has expanded gains to the most educated, those working in high tech fields.
Looking at the sources of income for the Top 1% its not so clear.

There is a lot of fluctuation but I don’t see anything to suggest that the income growth of the Top 1% is being driven by their position as high-end, highly technical wage earners (MDs, Executives, Software Architects)
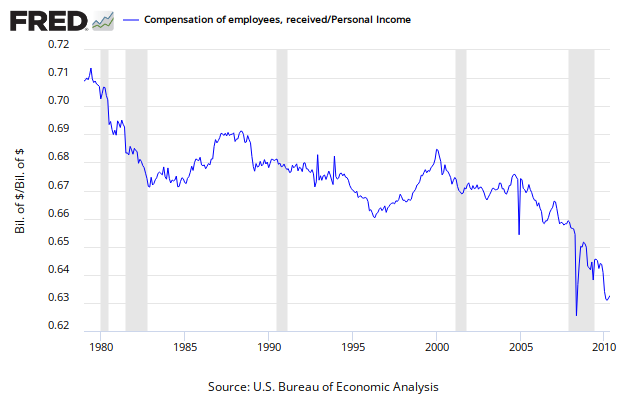
And at least in the aggregate, wage earnings seem to be becoming less important. The chart below show employee compensation as a fraction of personal income.
More analysis to come.
No comments:
Post a Comment