USuncutMN says: Tax the corporations! Tax the rich! Stop the cuts, fight for social justice for all. Standing in solidarity with http://www.usuncut.org/ and other Uncutters worldwide. FIGHT for a Foreclosure Moratorium! Foreclosure = homelessness. Resist the American Legislative Exchange Council, Grover Norquist and Citizen's United. #Austerity for the wheeler dealers, NOT the people.


We Are The 99% event

USuncutMN supports #occupyWallStreet, #occupyDC, the XL Pipeline resistance Yes, We, the People, are going to put democracy in all its forms up front and center. Open mic, diversity, nonviolent tactics .. Social media, economic democracy, repeal Citizen's United, single-payer healthcare, State Bank, Operation Feed the Homeless, anti-racism, homophobia, sexISM, war budgetting, lack of transparency, et al. Once we identify who we are and what we've lost, We can move forward.


Please sign and SHARE

Showing posts with label income inequality. Show all posts

Thursday, April 5, 2012

The Rag Blog: David P. Hamilton : Change You Can, You Know, Believe In...

The Rag Blog: David P. Hamilton : Change You Can, You Know, Believe In...


Graphic from Pyrrhic Defeat.

Consumer choice division:


Change you can believe in

By David P. Hamilton / The Rag Blog / April 4, 2012

I could no longer tolerate the bell chamber of American cable news. Its obsessive fixation on the still months-away American presidential election pitting two candidates approved by the 1% was driving me up the wall. I would regurgitate involuntarily if forced to watch one more of that repulsive manifestation of all the worst features of America, the Republican primary debates.


So, I dumped Time Warner for the Dish to get access to better news sources. The Dish gets us Al Jazeera, Democracy Now, and RT (Russia Today -- media home of numerous American leftists), Link TV, Free Speech TV, and several other international sources of information. What a relief. Now I had a much wider selection of biases. But there remain issues.

This enhanced news selection prominently includes the various shows of Thom Hartmann, most notably, the “Big Picture” that appears on both RT and Free Speech. He also does a couple of hours of live call-in, just him talking and answering calls on camera.

Thom is very busy and generally very sharp. We are fortunate that he is there. Sometimes he does a feature where he debates two rightists at the same time. They are perpetually on the defensive. We first caught his show on San Francisco’s cable television. Then we found a way to get him in Austin.

After watching a few days and getting a bit excited, I called Thom's show and asked the following question:

Thom, you support a constitutional amendment to take corporate money out of politics and revoke corporate personhood. So do I. But to enact a constitutional amendment, it must be passed by two-thirds of the members of the Congress and then in three-fourths of the state legislatures.

If our democracy is already seriously corrupted by corporate money, how can we expect legislators who are already largely sycophants of corporate America, to act against the interests of those who pay so handsomely for their services by voting for this amendment?

Thom’s answer, confirmed by his Washington reporter guest, was that they have heard many legislators say that they really hate having to raise money all the time. If only enough of the electorate pressured them, they would vote for the amendment. They essentially argued that these are good people who just need a little support in order to do the right thing.

Basically, I asked Thom whether or not democracy was already dead in America and Thom answered by saying no, just on life support.

As much as I admire Thom, there is some fuzzy thinking here. He is campaigning hard for an amendment that is premised on the idea that democracy in America is quite seriously compromised already. Yet he appeals to the corrupted institution to rise up and cleanse itself. You can’t have it both ways.

You can hardly expect the utmost beneficiaries of the burgeoning economic inequality that so heavily compromises our democracy to instruct their functionaries in the so-called “public” sector to rectify the situation in our favor.

Most legislators are already virtual employees of the less than 1%, the capitalist class who own the controlling interests in the major corporations. They are in that role because they are highly adapted to the corrupted system. They like money and power, the respectful recognition and bounteous benefits they acquire by being political operatives of the rich and powerful.

Thom’s answer posits that they are actually there to do what's best for the country and the general population and are only inhibited from doing so by the need to raise millions to run their necessarily expensive campaigns, money readily supplied by the dastardly corporations. That's nonsense. If that were true, they would have passed public financing of political campaigns years ago.

The amendment to overturn “Citizens United” may be a wonderful device to focus the public on the issue of how economic inequality corrupts our democracy, but it will pass when pigs fly.

Which brings us to a fundamental question. Is economic reform that measurably effects income distribution in the U.S., and consequently the class structure, still possible given the current level of political corruption by corporate money?

The answer is not very possible, if at all, and the potential is diminishing. The ruling economic elite can only be expected to instruct their political servants to minimize their social responsibilities as much as possible and to increase their access to government money. They have unswerving faith in a religion called the "Free Market” -- and Social Darwinism that allows them to take this course without the least guilt.

What is the difference in corporate deference between Democrats and Republicans? The former have progressive voting constituencies that must be placated to some small degree, but just enough to distinguish them from Republicans.

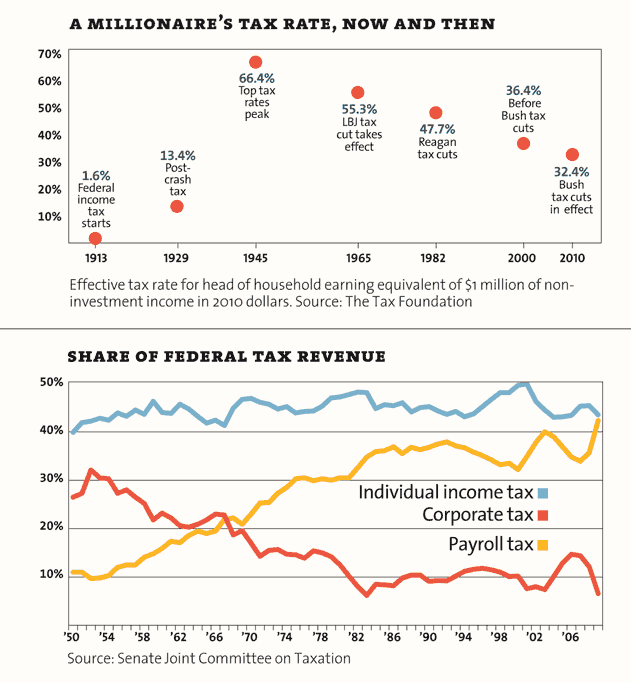
The most crucial arena is the tax structure. Specifically, will the Democrats end the Bush tax cuts for the rich when they again have the chance? Despite the fact they controlled both houses of Congress and the presidency for two years, they did not do so when it was last up for a vote. Will they risk bing labeled as those who raised taxes or will they again “bargain it away”? I advise you to limit your expectations.

Before the “Citizens United” decision, the barriers limiting corporate control of the political process were already full of holes. With that decision, they fell by the wayside entirely.

As a direct result, we today have the spectacle of a Las Vegas gambling tycoon openly giving $15 million to Newt Gingrich to run his campaign. Given the donor’s reputed wealth of many billions, that’s pocket change. That example is just the egregious tip of the iceberg. It would be hard to argue that most legislators are not already at this point, beneficiaries of significant corporate largesse.

This system, like others, produces politicians that are adaptive to it. Insofar as there are still shining examples of probity in regards to corporate cash, given this burst of judicial activism by the Supremes, they are a dying breed.

Witness the strenuous effort that has been exerted for years to get rid of Congressman Lloyd Doggett of Austin. Eventually, his right-wing detractors will find the right district, the right flunky, and enough big bucks to take him down.

Their personhood is immoral, devious, relentless, and infinitely well financed. Corporations will continue to own the controlling interest in an enterprise known as the U.S. government and they will expand their holdings, because there is nothing to stop them and very little chance that things will change.

Consider also the important role the federal government now plays in relation to the private sector. Forbes magazine recently reported that of the 10 richest counties in the U.S., half of them bordered on Washington, D.C. Average household income in these counties hovers around $100,000 per year.
In recent decades northern Virginia has become an economic dynamo, driven by a private sector that feasts on government contracting. These counties are also home to corporate lobbyists, lawyers and consultants who work in or around the nation's capital, soaking up federal government spending.
There is no other prize more valuable to corporate elites than maintaining their control over the power and wealth of the federal government for their private gain. They are firmly in the driver’s seat now and have the power to change the rules to their further advantage. No election occurring in other than catastrophic conditions will change that and in such conditions, they probably won’t allow elections.

As American anarchist Emma Goodman once said, "If you could change things by voting, it would be illegal."

Whatever may have been the case in the past, serious reform that alters the class structure or the political institutions of American society in favor of the 99% is no longer possible by electoral means.

[Rag Blog contributor David P. Hamilton has been a political activist in Austin since the late 1960s when he worked with SDS and wrote forThe Rag, Austin's underground newspaper. Read more articles by David P. Hamilton on The Rag Blog.]

Friday, September 2, 2011

America's massive racial wealth gap

INSTANT GUIDE
America's massive racial wealth gap 
White familes did poorly in the Great Recession, but the numbers are dramatically bleaker for black and Hispanic households  

POSTED ON JULY 27, 2011, AT 10:26 AM

Homeowners wait in line for a foreclosure prevention seminar in Florida: The Great Recession has turned the wealth gap between white and black families into a gaping chasm.
Homeowners wait in line for a foreclosure prevention seminar in Florida: 
The Great Recession has turned the wealth gap between white and black 
families into a gaping chasm.
Photo: Joe Raedle/Getty Images


The Great Recession afflicted much of America, but it hit some demographics harder than others. The Pew Research Center scrutinized the net wealth of different racial groups in 2005 and 2009, and found that the financial gap between whites and minorities has become increasingly "lopsided" (a "colossal understatement" on Pew's part, says Brian O'Connell at TIME). Pew adds that the wealth divide between white families and black and Hispanic households is bigger now than at any time since the Census Bureau began tracking such data by race in 1984. What's going on in America? Here, a brief guide


:Exactly how big is the wealth difference?White households were about 20 times wealthier than black ones in 2009, and 18 times wealthier than Hispanic ones. Every group's income fell between 2005 and 2009, but Hispanics' inflation-adjusted median wealth plummeted 66 percent, versus 53 percent among blacks, 54 percent among Asians, and just 16 percent among whites. As a result, the average white household had a net worth of $113,149 in 2009, a black household had $5,677, a Hispanic one, $6,325, and the average Asian household, $78,066. About a third of black and Hispanic households has zero or negative worth, versus 15 percent for whites.


How big did the gap used to be?In 1984, white households were 12 times wealthier than black households, and eight times wealthier than Hispanic ones. The gap was narrowest in 1995, when white households were only seven times wealthier than black and Latino ones. 


How does Pew define wealth?It looks at a household's assets (houses, cars, bank accounts, stocks and other investments, and retirement accounts) minus its debts (mortgages, car and student loans, credit card debt, etc.). Measuring wealth this way "can give a fuller picture of financial status than simply relying on household income," says Natasha Lennard at Salon. And since wealth can be passed on, while annual income can't, this inequality will probably only grow with time.


Why have whites fared so much better?"The bursting of the housing market bubble in 2006 and the recession that followed from late 2007 to mid-2009 took a far greater toll on the wealth of minorities than whites," the Pew study says. The housing implosion was especially hard on Hispanics, since a disproportionate number of them are concentrated in states like Florida, California, Arizona, and Nevada, where the housing boom and subsequent bust were especially dramatic. White households also have more diversified assets, including 401(k)s and IRAs, while blacks and Hispanics had more of their net worth in their homes. Since the stock market has bounced back since 2009 while the housing market is still weak, the wealth gap has already probably widened even more from its 2009 record, Pew says.


Sources: Business InsiderDaily KosJack & Jill PoliticsMediaiteNew York Times

Define Rich, Part III. What the tax tables of yore say.

http://www.angrybearblog.com/2011/09/define-rich-part-iii-what-tax-tables-of.html


Posted by Divorced one like Bush | 9/01/2011 02:03:00 PM


By Daniel Becker

Randolph Duke: Money isn't everything, Mortimer.
Mortimer Duke: Oh, grow up.
Randolph Duke: Mother always said you were greedy.
Mortimer Duke: She meant it as a compliment.

A while ago (an understatement) I posted on the question of what is rich. The first dealt with what issues to consider in defining rich. The second was looking at the issue of getting rich if that is even what one wants to do. The “rat race”. I don't believe most people really want to be rich. I believe most people when thinking about being rich are thinking about what it would take to remove the fears of events that would make one's life either very difficult in a world that requires money to remove risk or drastically different from what one's life was. I'm thinking things like losing a job, debilitating injury or illness possibly resulting in physical disability or Louis Winthorpe III.

This all ties into “The American Dream”. The “Dream” is not just an ideology of governance and social philosophy. It is also a life style and thus requires a specific level of income. I have posted on this issue also and noted just how high in income we have driven this “Dream” such that two people with bachelor’s degrees just starting life together may not be able to have it.

Now that we have entered a period where taxes are on everyone's minds such that there is serious consensus to raising taxes, maybe we need to see what we had in the past to know what we need now. I am sure most readers are aware of Mike's work defining what rates appear to effect economic growth the best. If I recall correctly the number for the top 1% was around 65%. I have also suggested that there is a range as to how large a share of the income the top 1% should have. That number for the top 1% is not to be above 15% and not to much below 10%.

I should also mention my postings on taxation’s purpose. Specifically I looked at taxing from the perspective of the legal profession as oppose to the economic profession. The conclusion was that there was one main reason for taxing. It is to fulfill the directive of our constitution: equality of power. It is to assure the concept of one voice one vote. If there was ever a time in our history to raise taxes in order to assure this directive it is now in the age of the Citizens United ruling. President FDR referred to the issue and those with the one voice multiple votes do to their monied power as “economic royalty”. I like that phrase and I wonder why it is not used as are retort to those who use “class warfare” as a guilt trip.

Let's get started.


I have constructed 4 sets of data using the tax rates of 1936/37, 1945/46, 1965/67 and 2010. I chose 1936 because it is a tax rate increase after the economy had turned north based on Mikes posting. I chose 1945/46 because it is another adjustment that happens right after after WWII. I chose 1965/67 because it is the decrease often spoken of fondly. Of course 2010 is because that is where we are at.

This posting would be hugely long if I post on all 4 periods at once, so I have broken it up. Let me first and I think most importantly note that we people today have no idea just how much we were willing to tax ourselves to have the society that we now refer to as “the good old days”. Not only did we have the tax tables of 1936, that table eventually had a 10% surcharge added to pay for the war. Yes, another reason to consider the generation that fought the 1st and 2nd world wars the greatest generation. There was a 7% surcharge for the Vietnam war, though that number became less as time passed. Still, we knew that if we wanted to do exceptional things, we had to tax ourselves exceptionally. Also, the early taxation made no distinction for single or married, never mind filing joint or separate. Everyone paid the same rate. Most interestingly, with the current table, the people who comparatively get screwed are those who are married and file separately. All the rates kick in at a lower income than even those who are single. The other thing we don't seem to understand is that all the tax rhetoric we have been hearing since Reagan we've heard before virtually to the word.

Andrew Mellon, Treasury Secretary 1921 to 1932 :

Generally speaking, Mellon argued that tax burdens were too high. Steep rates, he insisted, served only to stifle incentive and foster tax evasion. “Any man of energy and initiative in this country can get what he wants out of life,” he wrote. “But when initiative is crippled by legislation or by a tax system which denies him the right to receive a reasonable share of his earnings, then he will no longer exert himself and the country will be deprived of the energy on which its continued greatness depends.”

Worse yet, Mellon argued, high rates didn’t even raise money. By encouraging both legal tax avoidance and illegal tax evasion, they eroded the tax base and reduced overall revenue. Lower rates, he said, would actually raise money by spurring economic growth and reducing the incentive for tax avoidance. “It seems difficult for some to understand,” he complained, “that high rates of taxation do not necessarily mean large revenue to the government, and that more revenue may actually be obtained by lower rates.” In particular, Mellon insisted that high rates distorted investment decisions, boosting the popularity of tax-free state and local government bonds. Indeed, Mellon made these tax-free bonds a regular target of his reform attempts, but Congress resisted his plans to eliminate them.

Atlas Shrugged wasn't even written then!  What we don't hear much of are the original concerns and reasoning for progressive taxation. Teddy Roosevelt:

1906...We should discriminate in the sharpest way between fortunes well-won and fortunes ill-won; between those gained as an incident to performing great services to the community as a whole, and those gained in evil fashion by keeping just within the limits of mere law-honesty.

1907 regarding an income tax:...while in addition it is a difficult tax to administer in its practical working, and great care would have to be exercised to see that it was not evaded by the very men whom it was most desirable to have taxed, for if so evaded it would, of course, be worse than no tax at all; as the least desirable of all taxes is the tax which bears heavily upon the honest as compared with the dishonest man.

No advantage comes either to the country as a whole or to the individuals inheriting the money by permitting the transmission in their entirety of the enormous fortunes which would be affected by such a tax; and as an incident to its function of revenue raising, such a tax would help to preserve a measurable equality of opportunity for the people of the generations growing to manhood. We have not the slightest sympathy with that socialistic idea which would try to put laziness, thriftlessness and inefficiency on a par with industry, thrift and efficiency; which would strive to break up not merely private property, but what is far more important, the home, the chief prop upon which our whole civilization stands. Such a theory, if ever adopted, would mean the ruin of the entire country--a ruin  which would bear heaviest upon the weakest, upon those least able to shift for themselves.


At this moment, I want to mention corporate taxes. There are lessons to be learned from it's history. I think it is a factor in understand more completely the issue Mike is focusing on: taxation and GDP growth. Wrap your minds around the fact that from 1936 to 1943 there were 6 years that corporate tax collections were greater than personal income tax collections. 1943 was the best year for this as personal income tax collections were 68.1% of the corporate tax collections. Just one year later it flips to corporate tax collections being 75.3% of personal income tax collections. In 1944 $34,543 million in total for the two taxes was collected vs 1943 $16,062 million in total.  In fact, personal income taxes remain in the mid to high 40 percent of total revenue collections from 1944 to present. The corporate share of total revenue peaks in 1943 at 39.8% and declines to hover around the 10% level with a few ventures into the single digits. Most notably 1983 the corporate share was 6.2% and 2009 it was 6.6%.
First up is our current tax table. I used the “married filling jointly” as that would be consistent with the other tables. One big rule of this series of postings: DO NOT concern yourself or me about the deductions that exist. They do not matter for this presentation and for all intent and purposes we can consider the income to have already gone through the deduction calculator and is now ready to have the tax table applied. This is because, these tables only apply to adjusted gross income.


You will notice that the table is calculated out to $,1,000,000 of income. I did this in order to keep all the tables going to the same income level. The 1936 table actually has rates for incomes up to $8 million. That is $8 million in 1936. (Using my favorite money converter that would be $301,000,000 in unskilled labor or $573,000,000 in GDP/capita.) Going to $1,000,000 in income also allows one to see what happens at the top when the rate no longer rises.

A very important concept to understand is that not every dollar is taxed at the single percentage rate as you go up the income ladder. Thus, there are two columns in my charts. The “Marginal Tax” is the additional money paid at the top of the bracket for the corresponding rate. The “Total tax” is the actual money paid up to that level. It is the “effective rate”. In simple terms, if you are at the 35% level, you 
are not paying 35% on all that you earn. Instead you are paying the amount based on your income being divided up into the number of brackets that exist. For 2010, there are 6 brackets, thus you have six different incomes so to speak.

This is what it looks like as a graph.

When the rate maxed out, I divided the range to $1 million into even parts so that the tax paid for each additional income level is the same. For the 1945/46 and 1965/67 data sets I converted the net income to 2010 dollars. I used the “unskilled labor” and GDP/cap as those are the 2 factors suggested as being the best for knowing what income equivalents are over time. The 1936 data set is converted to 1967 dollar because the numbers just get crazy. For example, a net income of $3840 is $145,000 in unskilled labor and $275,000 in GDP/cap. Though it is only $60,400 via the CPI. Which doesn't say much for today's median family income. It also gives us a clue as to just how much money is considered “rich”.

Next posting, I will start presenting the historical data sets. I'm still thinking about the best way to do it as what is important is the comparison among the data sets.  Maybe post just the data charts and later the graphs or maybe one data set and it's graphs at a time. 

Friday, April 22, 2011

Income Inequality: Modelledbehavior.com

Via Andrew Sullivan Lane Kentworthy charts US income disparity
TopPercent
Its impressive that the income for the Top 1% races off while the income for the middle and lower class is squished towards the bottom.
I was concerned, however, that this chart might be somewhat misleading because even if the various income classes had the same growth rate – not suggesting they did, just saying – the increases for the Top 1% would dwarf everyone else, since they started from a higher baseline.
I tried plotting the income growth as common logs
image
A similar though, perhaps, less shocking looking story. There is growth, albeit mild in the middle and lower classes, and stronger more robust growth among the Top 1%.
If your used to common logs then you can see that the Top 1% moved from being about an order of magnitude above the middle class to about one and half orders. Or in other words from 10 times greater to 30 times greater.
However, you still don’t get a good sense of the trajectory. For that I plotted an index scale where 100 is income in 1979.
image
Here we can see that the Top 1% has more than triple its income with fairly steady growth since 1980. The middle and lower classes have seen only about a 15% increase in real income with all of those gains coming after the early 90s.
What’s even more interesting to me is that the gains to the Top 1% seem to be steady and at first glance trend reverting. That is, there appears to be a consistent underlying rate of growth ever since 1980, with income rising above trend during booms and falling below during recessions.
Plotting the trend line reveals that the Top 1% is seeing its income grow at roughly 4.2% per year in real terms.
image
This is significantly faster than real growth of US GDP.
image
My first question then is whether this is increasing take of GDP is because of the Top 1% position as high end wage earner or owners of capital. The standard story has largely been that increases in technology has expanded gains to the most educated, those working in high tech fields.
Looking at the sources of income for the Top 1% its not so clear.
image
There is a lot of fluctuation but I don’t see anything to suggest that the income growth of the Top 1% is being driven by their position as high-end, highly technical wage earners (MDs, Executives, Software Architects)
And at least in the aggregate, wage earnings seem to be becoming less important. The chart below show employee compensation as a fraction of personal income.
FRED Graph
More analysis to come.

Thursday, February 24, 2011

It's the inequality, Stupid: Mother Jones

http://motherjones.com/politics/2011/02/income-inequality-in-america-chart-graph


Eleven charts that explain everything that's wrong with America.
— By Dave Gilson and Carolyn Perot

How Rich Are the Superrich?

A huge share of the nation's economic growth over the past 30 years has gone to the top one-hundredth of one percent, who now make an average of $27 million per household. The average income for the bottom 90 percent of us? $31,244.

Average Income by Family, distributed by income group.
Advertise on MotherJones.com
The richest controls 2/3 of America's net worth

Note: The 2007 data (the most current) doesn't reflect the impact of the housing market crash. In 2007, the bottom 60% of Americans had 65% of their net worth tied up in their homes. The top 1%, in contrast, had just 10%. The housing crisis has no doubt further swelled the share of total net worth held by the superrich.

Winners Take All

The superrich have grabbed the bulk of the past three decades' gains.

Aevrage Household income before taxes.

Out of Balance

A Harvard business prof and a behavioral economist recently asked more than 5,000 Americans how they thought wealth is distributed in the United States. Most thought that it’s more balanced than it actually is. Asked to choose their ideal distribution of wealth, 92% picked one that was even more equitable.

Average Income by Family, distributed by income group.

Capitol Gain

Why Washington is closer to Wall Street than Main Street.

median net worth of american families, median net worth for mebers of congress, your odds of being a millionaire, member of congress's odds of being a millionaire
member max. est. net worth
Rep. Darrell Issa (R-Calif.) $451.1 million
Rep. Jane Harman (D-Calif.) $435.4 million
Rep. Vern Buchanan (R-Fla.) $366.2 million
Sen. John Kerry (D-Mass.) $294.9 million
Rep. Jared Polis (D-Colo.) $285.1 million
Sen. Mark Warner (D-Va.) $283.1 million
Sen. Herb Kohl (D-Wisc.) $231.2 million
Rep. Michael McCaul (R-Texas) $201.5 million
Sen. Jay Rockefeller (D-W.Va.) $136.2 million
Sen. Dianne Feinstein (D-Calif.) $108.1 million
combined net worth: $2.8 billion
10 Richest Members of Congress 100% Voted to extend the cuts
Congressional data from 2009. Family net worth data from 2007. Sources: Center for Responsive Politics; US Census; Edward Wolff, Bard College.

Who's Winning?

For a healthy few, it's getting better all the time.

Gains and Losses in 2007-2009, Average CEO Pay vs. Average Worker Pay

A millionaire's atx rate, now and then. Share of Federal Tax revenue

YOUR LOSS,THEIR GAIN

How much income have you given up for the top 1 percent?

 
Sources

Income distribution: Emmanuel Saez (Excel)

Net worth: Edward Wolff (PDF)
Household income/income share: Congressional Budget Office
Real vs. desired distribution of wealth: Michael I. Norton and Dan Ariely (PDF)
Net worth of Americans vs. Congress: Federal Reserve (average); Center for Responsive Politics (Congress)
Your chances of being a millionaire: Calculation based on data from Wolff (PDF); US Census (household and population data)  
Member of Congress' chances: Center for Responsive Politics
Wealthiest members of Congress: Center for Responsive Politics
Tax cut votes: New York Times (Senate; House)
Wall street profits, 2007-2009: New York State Comptroller (PDF)
Unemployment rate, 2007-2009: Bureau of Labor Statistics
Home equity, 2007-2009: Federal Reserve, Flow of Funds data, 1995-2004 and 2005-2009 (PDFs)
CEO vs. worker pay: Economic Policy Institute
Historic tax rates: Calculations based on data from The Tax Foundation
Federal tax revenue: Joint Committee on Taxation (PDF)

Read also: Kevin Drum on the decline of Big Labor, the rise of Big Business, and why the Obama era fizzled so soon.
More Mother Jones charty goodness: How the rich get richer; how the poor get poorer; who owns Congress?
Dave Gilson is a senior editor at Mother Jones. For more of his stories, click here. Get Dave Gilson's RSS feed.